Arduino and HRV Analysis
This page contains resources for the "Developing STEM skills using Arduino and heart rate variability analysis" workshop as presented at the 2018 Deakin STEM Education Conference.
The code provided on this page is intended for educational use only and should not be used for medical purposes.
Table of Contents
Introduction
With the introduction of wearable sensors and the Internet of Things (IoT), the use of physiological signals to continuously assess our mental and physical state is growing rapidly. This field offers an exciting opportunity to learn a range of science, technology, engineering and mathematics (STEM) skills using widely available low-cost devices such as the Arduino.
In this workshop, we'll show you how to record your heart rate using the Arduino platform and describe a series of practical activities based on heart rate variability (HRV) analysis. Targeted at senior secondary and first year undergraduate students, this workshop aims to inspire you to develop your STEM skills and learn how they can be used to understand the electrical rhythms of our bodies.
Physiology
To begin, let's recap the basics of what determines our heart rate. The main system responsible for coordinating this task is known as the autonomic nervous system or ANS. The ANS is responsible for a large range of bodily functions including heart rate, digestion, respiration and more. The two main branches of the ANS which relate to heart rate are known as the sympathetic and the parasympathetic nervous systems.
The sympathetic nervous system is associated with our "fight-or-flight" response and acts to increase the heart rate, while the parasympathetic nervous system is associated with "rest-and-digest" activities and acts to decrease the heart rate. These two systems exert control over our heart rate by sending signals to a bundle of cells in the heart known as the sinoatrial node.
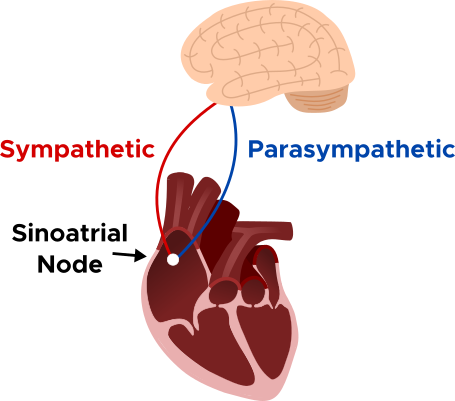
The sinoatrial node, also known as the heart's natural pacemaker, is a group of cells that produce regular electrical impulses which cause the heart to contract and pump blood throughout the body. Based on the timing of these heart contractions, we can determine an enormous amount of information about a person, including their emotional state, stress levels, sleep quality and more.
Measurement
So how do we measure the heart rate? There are many different ways to achieve this, but for the purposes of this workshop we are going to focus on measuring the electrical activity produced by the heart and how it can be interpreted.
To understand this process, we first need to recap a bit of physics. As you might know, all materials are made of atoms, which are in turn made of smaller particles called protons, neutrons and electrons.
Materials are said to have positive charge when they contain fewer electrons than protons and negative charge when they contain more electrons than protons. The flow of electrons from one material to another is what we call electricity. It can be described using the following terms:
Current – The flow of electrons between a negatively charged material and a positively charged one.
Voltage – The difference between the charge in one material compared to another.
Resistance – A measure of whether it is easy or hard for electrons to move through a particular material.
Current, voltage and resistance are related by an equation known as Ohm's law:
\[ V = I \times R\]
V – Voltage in Volts (V) I – Current in Amperes (A) R – Resistance in Ohms (Ω)
To measure the electrical activity of the heart, we are going to look at the difference in voltage measured at different points across the body.
Components
To do this, we're going to need a few pieces of equipment as given in the table below:

|
Arduino Uno R3 | $13.20 AUD |
|---|---|---|

|
DFRobot Gravity ECG Kit | $31.86 AUD |

|
Plug to Plug Jumper Cables | $2.95 AUD |
Prices updated as of 01/01/2021
Software setup
Once you've got everything ready, let's start by setting up the Arduino software:
- Go to the Arduino Software Downloads webpage.
- Scroll to "Download the Arduino IDE".
- Click the download for your operating system (e.g. Windows/Mac/Linux).
- Double click and install the downloaded file.
Hardware setup
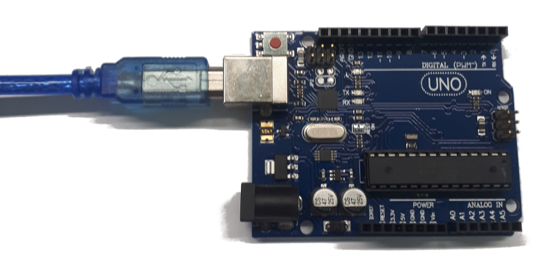
Connecting the Arduino board
- Plug the USB cable into the Arduino board.
Plug the other end of the USB cable into your computer.
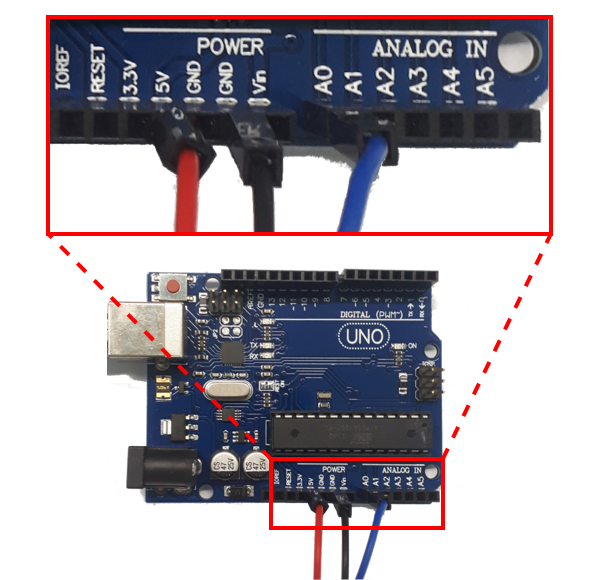
Connecting the ECG kit
Plug one end of the red wire into the 5V socket.
Plug one end of the black wire into the GND socket.
Plug one end of the blue wire into the A0 socket.
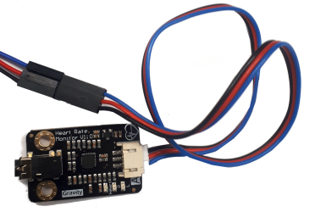
Plug the other end of the red, black and blue wires into the Gravity ECG module.
Plug the grey ECG lead (looks like a headphone jack) into the Gravity ECG module.
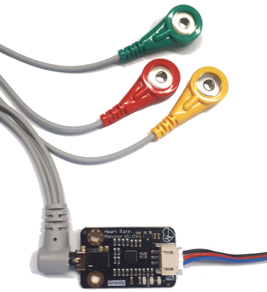
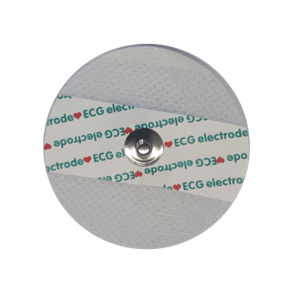
Attaching the ECG electrodes
Place the three ECG patches on a hard surface with the metal button facing up. Do not remove the adhesive backing yet.
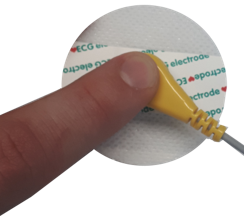
Press the three ECG clips (i.e. green, red and yellow leads) down firmly onto each of the three ECG patches.
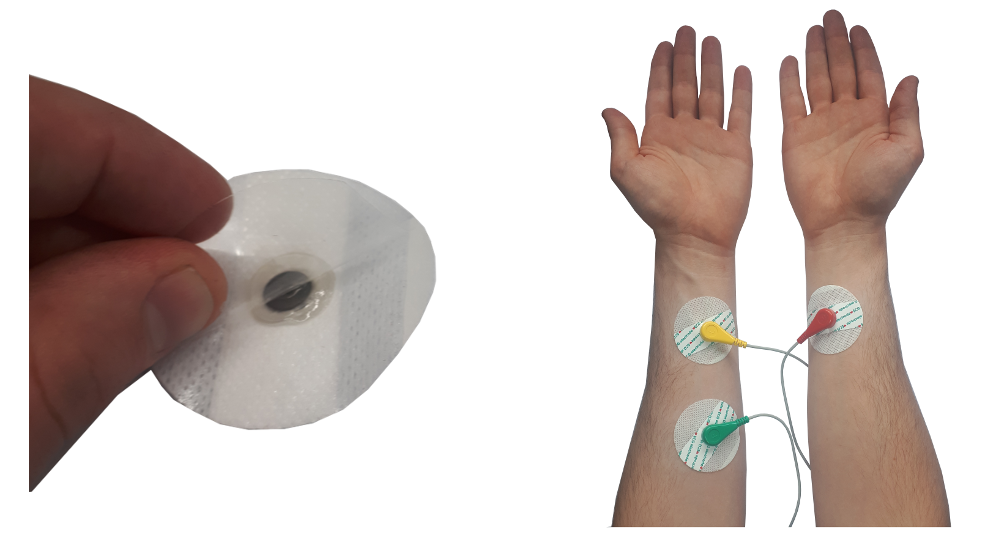
Remove the adhesive backing from each ECG patch and place them onto your arms as shown below.
Programming
For this section you'll need to download the following file: ecg.ino
Once ecg.ino has been downloaded, double click the file to open it in the Arduino IDE.
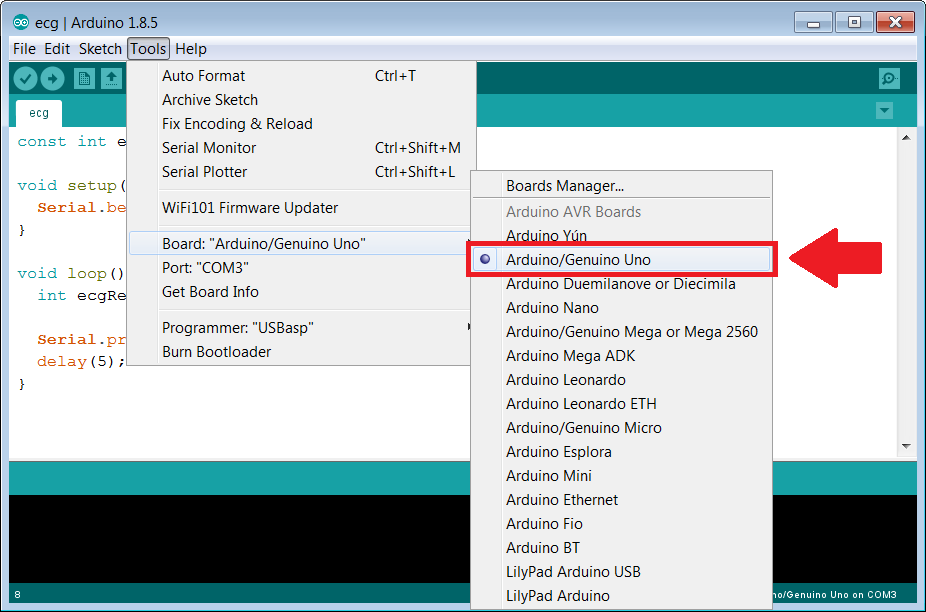
After the Arduino software has opened, navigate to Tools and ensure the Arduino/Genuino Uno board is selected as shown below.
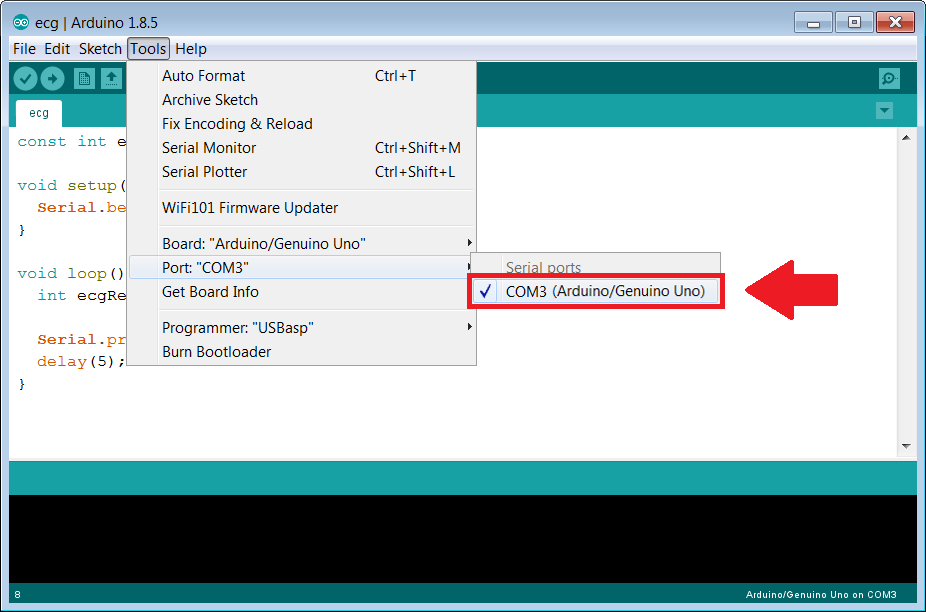
Next, ensure the correct COM port is selected. The correct COM port should list the name of the Arduino device in brackets as shown below.
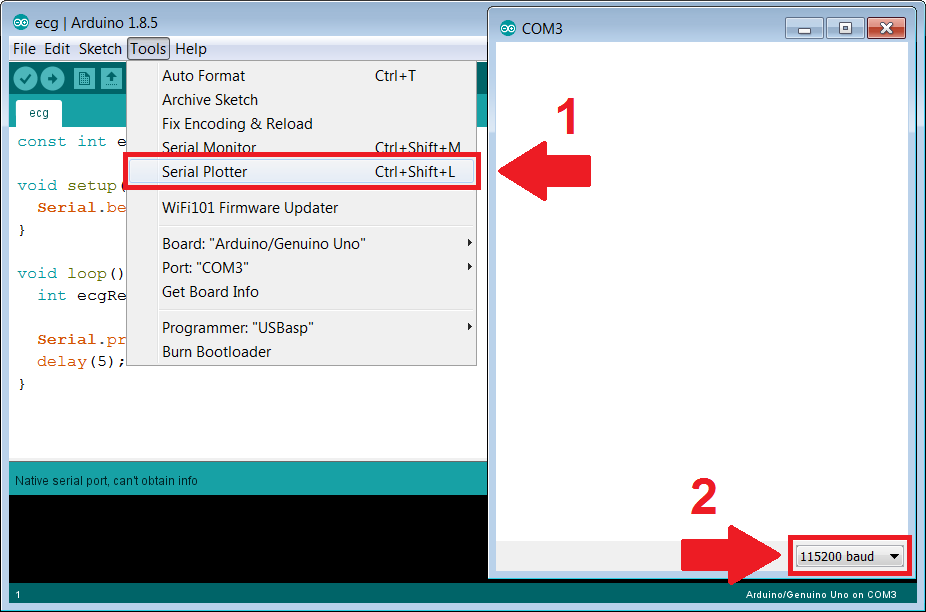
Next, check that the Serial Plotter is set to the correct baud rate by first pressing Serial Plotter and then setting the baud rate to 115200 baud in the popup window.
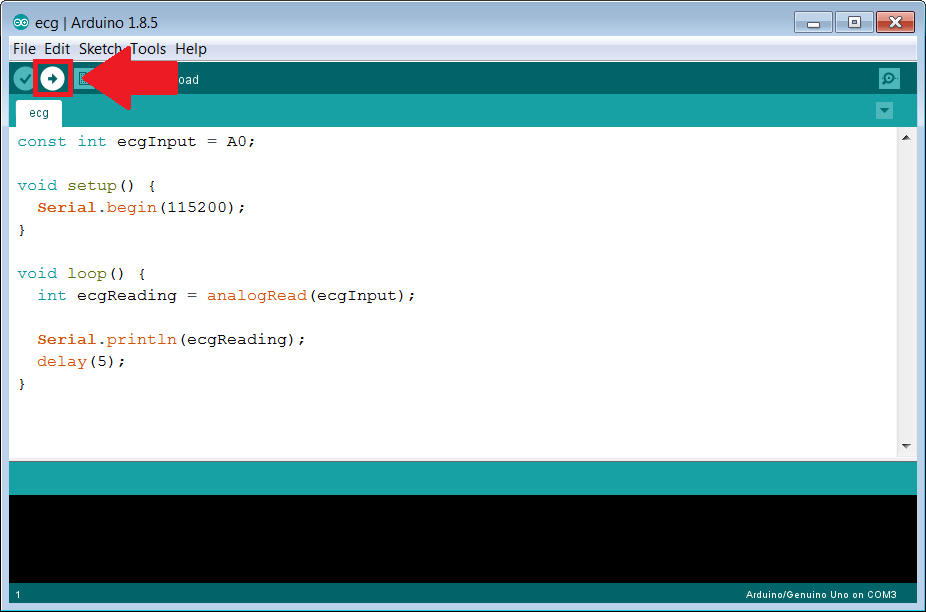
Finally, send the code to the Arduino board by clicking the Upload button.
If everything has been set up correctly, you should now see your ECG appear in the serial plotter window as shown below.
AVNN - The mean of heart beat intervals in each 5 minute reading.
SDNN - The standard deviation of heart beat intervals in each 5 minute reading.
SDSD - The standard deviation of successive differences between heart beat intervals in each 5 minute reading.
Jog on the spot for 1 minute
Box breathe for 1 minute
Watch an exciting YouTube video

Data analysis
Now that we are receiving the ECG data on the Arduino, it's time to start our analysis. Firstly, from the ECG waveform, we can highlight a few features in each cardiac cycle as shown below:
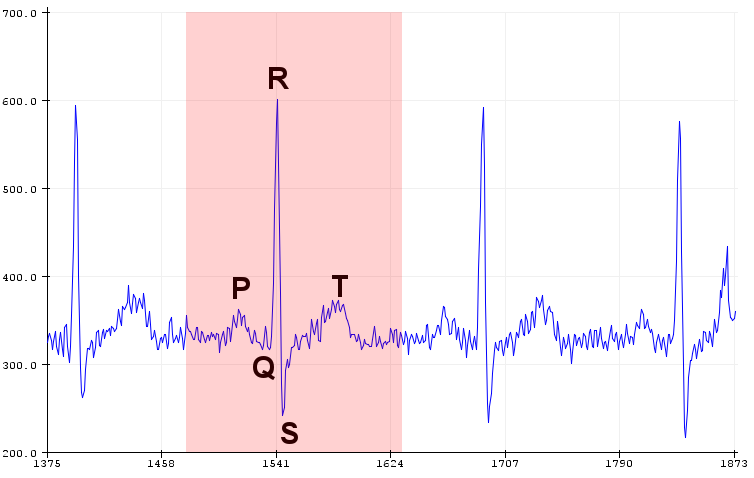
These features, known as the P wave, QRS complex and T wave, consist of different areas in the heart being electrically activated during each heartbeat.
The P wave results from electrons travelling from the sinoatrial node located in the upper right atrium towards the atrioventicular node which connects the atria and ventricles. The QRS complex then results from electrons flowing through the cardiac muscle as the ventricles contract (depolarisation), followed finally by the T wave which results from the relaxation of the cardiac muscle (repolarisation). A great animation of this process is shown below (click here for the full video).
Our heart rate is determined by the time interval between each R peak, also known as the RR interval, where its value in beats per minute (or bpm) is given by the following formula:
\[ \text{Heart rate (in bpm)} = \frac{60}{\text{Time between r peaks (in seconds)}}\]
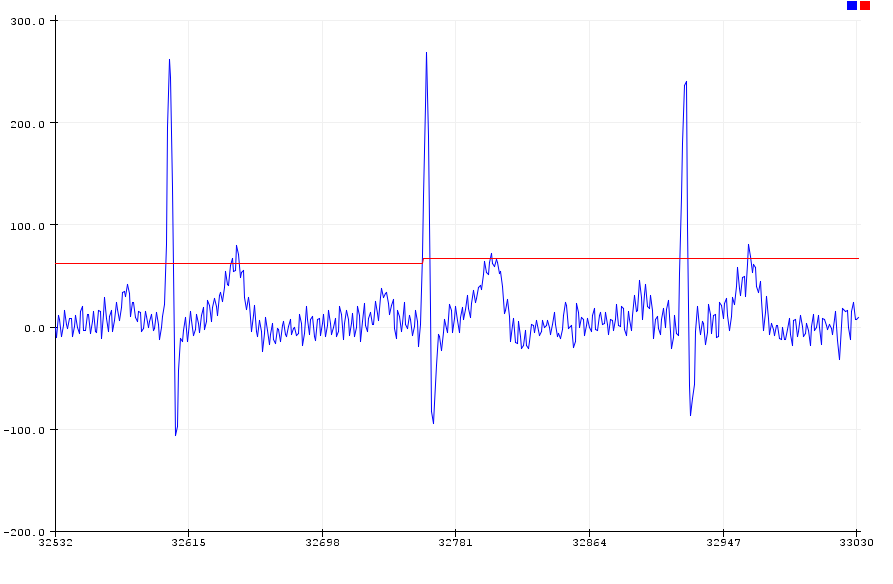
To calculate your heart rate using the Arduino, try uploading the following code: heartrate.ino
Once you have this code running, you should see your heart rate displayed alongside your ECG. If you don't see anything, first try adjusting the ecgOffset value so that your ECG reading is centred around a value of 0. Next, adjust the upperThreshold to a value less than your smallest R peak but greater than your largest T wave and the lowerThreshold to a value slightly below this. If everything is set up correctly, your plot should look like the below where the red line indicates your heart rate in bpm. Additionally, you should see the inbuilt LED on the Arduino blink every time a heart beat is detected.
Now that we are reading our heart rate, it's time to dive a bit deeper into HRV analysis. This field encompasses a huge range of techniques, so for this workshop we are going to focus on calculating a single commonly used HRV feature: the root mean square of successive differences (RMSSD). RMSSD can be computed using the following equation:
\[ \text{RMSSD} = \sqrt{\frac{\sum_{i=1}^{n-1} (RR_{i} - RR_{i+1})^2}{n-1}}\]
where n is the total number of RR intervals detected.
To compute the RMSSD, try uploading the following code to your Arduino: hrv.ino
This code has been configured to measure the RMSSD over an approximate 5 minute period which is a commonly utilised window for short term HRV analysis. For a reference on typical HRV values in 5 minute recordings across different age and sex groups, see Table 5 and Table 7 in this paper. As an example from this study, in the 25 to 34 year old age group, women had a typical RMSSD of 42.9 ± 22.8 and men had a typical RMSSD of 39.7 ± 19.9 (mean ± standard deviation).
Note that in short term recordings, HRV measures such as RMSSD can be highly sensitive to bad sensor readings, so make sure to check your RR intervals to ensure they are valid if you are getting very large RMSSD values.
In addition to RMSSD, there are a large number of other HRV measures which have been proposed such as:
For the final activity of this workshop, try writing code to calculate these three features and take your HRV measurements for 5 minutes immediately before and after completing one of the following activities:
Conclusion
Congratulations! You should now have learned some tools to measure and analyse the electrical activity of your heart. For more advanced activities, you could try making your heart rate monitor wireless using the ESP8266 microcontroller or check out this free book on the theory of bioelectromagnetism. If you're looking to dive deeper into HRV analysis, try downloading the amazing open-source PhysioZoo toolkit. We hope you have enjoyed this workshop and don't be afraid to leave a comment below if you have any questions.
Acknowledgement
This workshop was developed in collaboration between the following authors and institutions:
Emerson Keenan\(^1\), Mehrnaz Shoushtarian\(^2\), Chandan Kumar Karmakar\(^{1,3}\), Marimuthu Palaniswami\(^1\)
\(^1\) Department of Electrical and Electronic Engineering, The University of Melbourne, Parkville, VIC 3010, Australia
\(^2\) The Bionics Institute, East Melbourne, VIC 3002, Australia
\(^3\) School of Information Technology, Deakin University, Burwood, VIC 3125, Australia